We build digital products, optimize infrastructure, and help organizations navigate the digital age by empowering what matters most — people.
Migrating Traeger Grills to AWS, preserving a seamless experience.
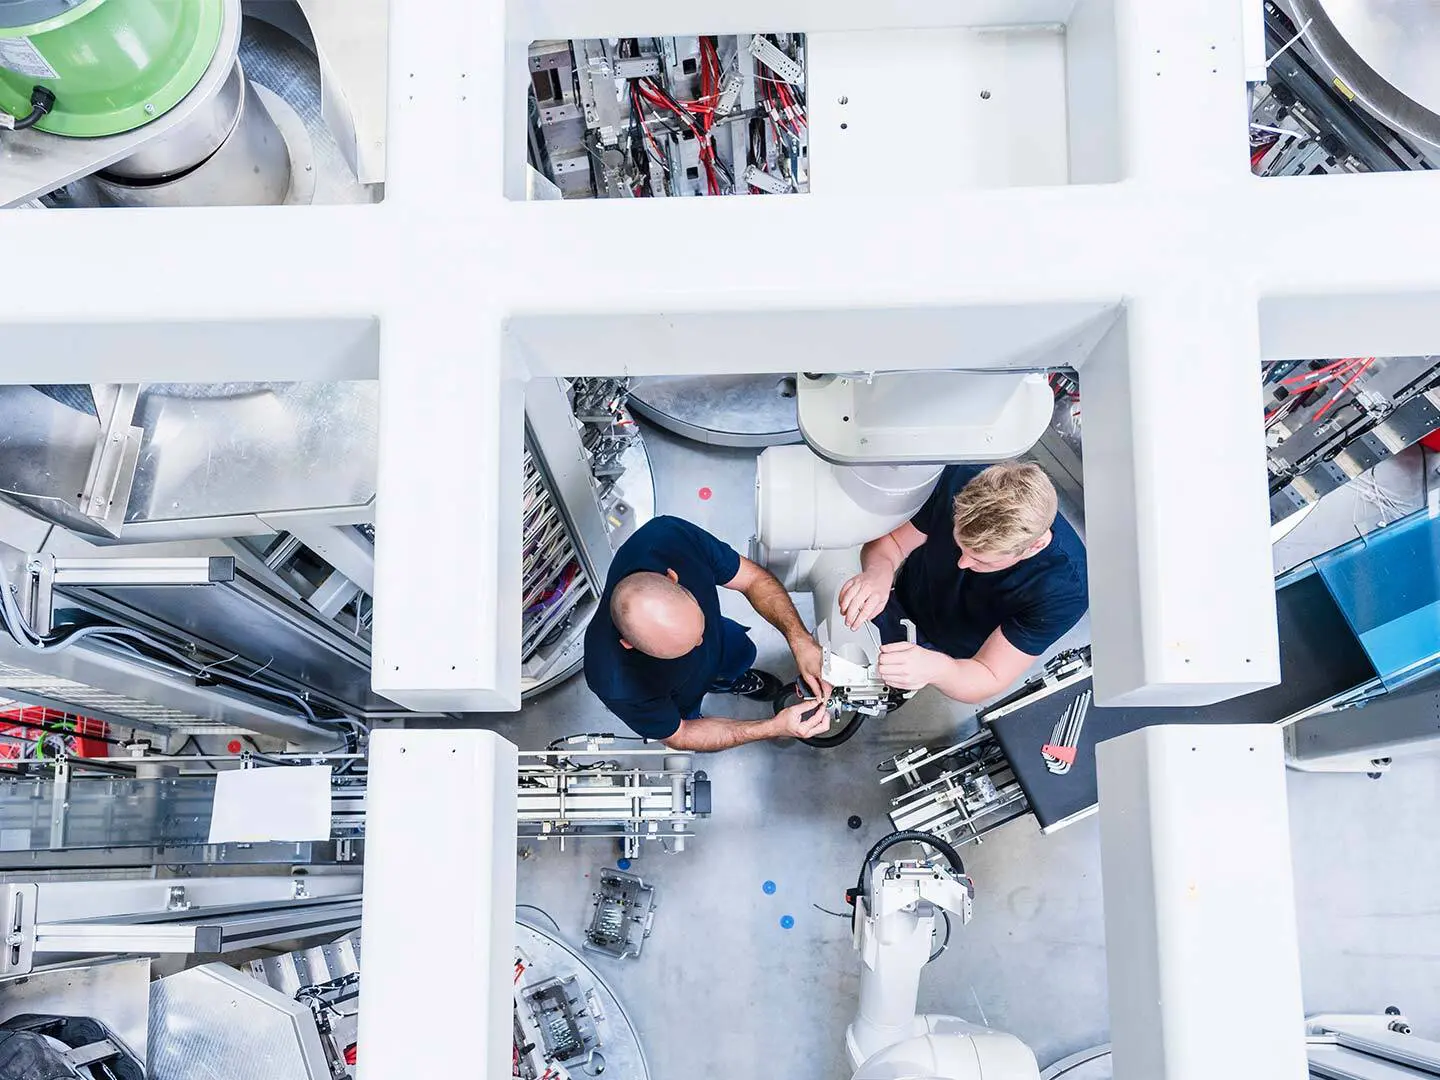
We are a technology consultancy leading innovation from the heart of strategy, technology, and experience.
Building Connected Experiences From the Ground Up
Explore our viewpoints rooted in real experiences that empower change.
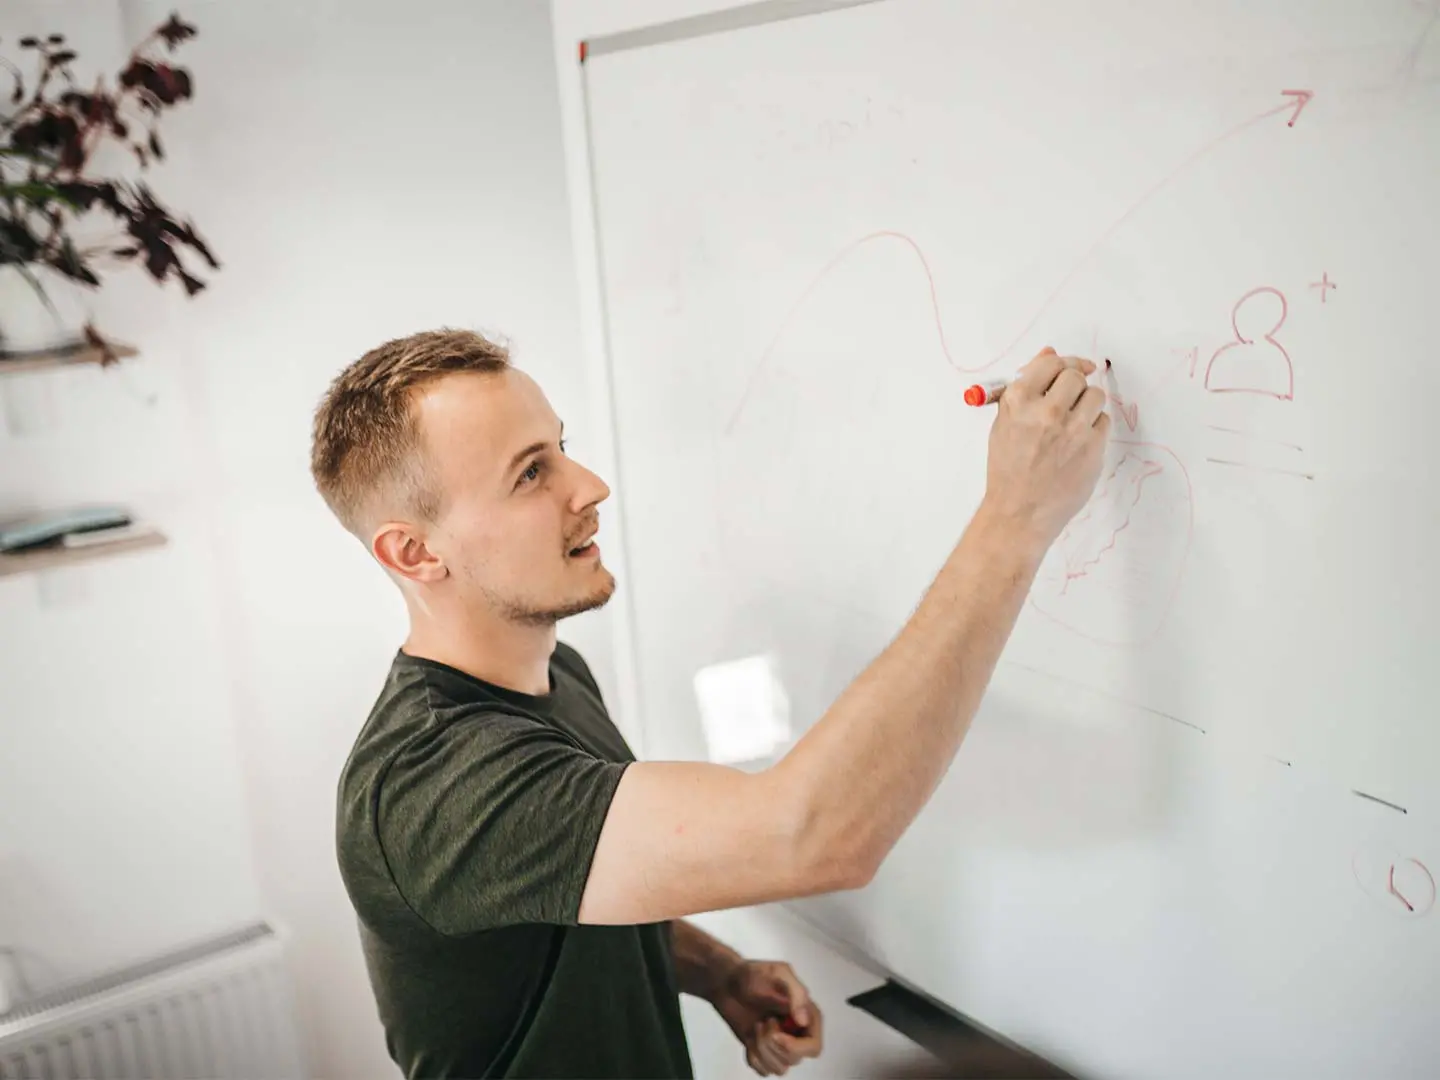
3 Essential Considerations for Successfully Designing a Product
Article